The crypto market runs on emotion. Panic selling during crashes and FOMO buying at peaks have cost investors billions over the years. The Bitcoin Fear Greed Index offers a way to measure these swings in market psychology and potentially flip crowd behavior into your advantage. This guide breaks down exactly how the index works, what its readings mean, and how you can use it to inform your investment decisions.
The fear and greed index is a sentiment gauge that runs from 0 to 100, where lower numbers signal fear and higher numbers signal greed. Historically, the best buying zones for long term investors have clustered in the extreme fear and fear ranges, not during periods of optimism.
Readings between 0 and 24 (Extreme Fear) and 25 to 39 (Deep Fear) have often coincided with attractive Bitcoin entry points that delivered strong returns over subsequent months and years. Consider these concrete examples:
March 13, 2020: The index dropped near 10 while Bitcoin traded under $5,000 during the Covid crash. Buyers who accumulated here saw BTC rise above $60,000 within 14 months.
June 19, 2022: The greed index plunged to 6 with Bitcoin around $17,500. This marked one of the lowest readings in the index’s history and preceded a prolonged bottoming phase before the next bull cycle.
Conversely, readings between 75 and 100 (Extreme Greed) have frequently preceded sharp drawdowns. These periods are better suited for taking profits rather than opening large new positions.
Key reminder: The index is a sentiment compass, not a guarantee. Combine it with risk management basics and simple technical levels like the 200 day moving average before making investment decisions.

The Bitcoin Fear Greed Index compresses current market sentiment into a single number from 0 to 100. This score provides a snapshot of investor sentiment at any given moment, helping traders understand whether the crowd is fearful or greedy.
A reading of 0 represents maximum fear, while 100 indicates maximum greed. The index updates daily based on a combination of market data and online activity signals. Think of it as a mood ring for the cryptocurrency market.
The index is Bitcoin centric by design, though many traders extrapolate its readings to inform views on the broader crypto market. When Bitcoin sentiment shifts, altcoins typically follow with amplified moves in either direction.
The sentiment bands break down like this:
0 to 24: Extreme Fear (market participants in panic mode)
25 to 49: Fear (caution dominates, prices often discounted)
50: Neutral (balanced sentiment)
51 to 74: Greed (optimism rising, FOMO building)
75 to 100: Extreme Greed (euphoria, high risk environment)
Popular providers like Alternative.me began publishing their version of the index in early 2018. It quickly became a reference tool across the crypto community for gauging whether conditions favor buying, selling, or waiting.
The index is computed from several weighted components tied to Bitcoin market data and online activity. Each factor captures a different angle of market psychology, and they combine into the final score through a weighted average normalized to the 0 to 100 scale.
Volatility (approximately 25 percent weight) measures how much Bitcoin’s price swings compared to 30 day and 90 day averages. When market volatility spikes significantly above normal, it often signals fear. Sharp drawdowns and wild intraday swings make market participants nervous, pushing the score lower.
Market momentum volume (approximately 25 percent weight) tracks trading activity relative to recent history. Strong upside momentum with heavy current volume typically increases greed readings. On the flip side, capitulation volume spikes during selloffs can push fear higher as panic selling dominates order books.
Social media sentiment (approximately 15 percent weight) comes from platforms like X (formerly Twitter) and Reddit. Algorithms analyze Bitcoin related keywords, hashtags, and engagement speed. Rapid positive interactions and viral posts about price gains suggest greed, while sparse activity or doom posting aligns with fear.
Bitcoin dominance (approximately 10 percent weight) measures BTC’s market share versus altcoins. Rising dominance during crashes often shows investors fleeing riskier digital assets for the relative safety of Bitcoin. Declining dominance can reflect greed as traders chase higher returns in smaller coins.
Google Trends (approximately 10 percent weight) analyzes search volume for crypto related terms. The system distinguishes between queries like “Bitcoin crash” or “Bitcoin scam” versus “how to buy Bitcoin.” Fearful searches lower the score while optimistic queries raise it.
Sentiment surveys (approximately 15 percent when available) previously incorporated poll data from the crypto community. This component is currently paused according to official sources but may return in future updates.
The final score emerges when these factors are weighted, combined, and normalized to create one point of reference that traders can watch daily.
The index becomes most useful when you interpret it by zones rather than obsessing over single numbers. Each zone maps to different types of trading behavior and carries distinct implications for your strategies.
Extreme Fear (0 to 24) typically appears during capitulation events, forced selling, liquidation cascades, and waves of bad news. Headlines scream disaster. The crypto community spirals into pessimism. This is precisely where behavior problems emerge for most investors. They sell at the worst possible moment. For contrarian buyers, these readings signal oversold conditions and potential buying opportunities. Long term investors often accumulate heavily when others cannot bear to watch their portfolios.
Fear (25 to 49) represents discounted but uncertain conditions. You often see these readings after a strong drawdown or during macro stress. Prices may stabilize but confidence remains shaky. Cautious dollar cost averaging can make sense here as you practice waiting for the crowd to regain composure.
Neutral (around 50) signals balance between buyers and sellers. Market trends become harder to predict and timing edges shrink. These periods often coincide with sideways consolidations where strategy matters more than sentiment. Neither extreme readings nor obvious opportunities exist.
Greed (51 to 74) emerges when optimism builds, new retail inflows appear, and funding rates climb. FOMO begins to develop as prices rise. This is not necessarily a sell signal, but careful profit taking and tighter risk control become advisable. The crowd grows confident, which historically precedes corrections.
Extreme Greed (75 to 100) marks euphoria. Parabolic moves, meme coin frenzies, and heavy leverage usage define these periods. Everyone believes they are financial geniuses. Disciplined investors usually trim exposure, hedge positions, or simply stop buying. Extreme readings at this end of the scale have repeatedly marked major cycle tops.
Market volatility is at the heart of the fear and greed index, acting as a powerful driver of market sentiment and shaping the mood of the entire crypto market. When prices swing wildly, it’s not just numbers on a screen—these moves trigger emotional reactions among market participants, fueling waves of crypto fear or bursts of optimism that the greed index captures in real time.
Volatility is a major factor in the index, accounting for a full quarter of its calculation. When the crypto market experiences sharp price drops or sudden surges, the index often reflects this with extreme readings. Spikes in volatility typically signal extreme fear, as investors worry about further losses and may resort to panic selling. On the flip side, periods of low volatility can lull investors into a sense of security, leading to increased greed as confidence grows and more people chase quick profits.
Understanding how volatility shapes the fear and greed index can help investors avoid common behavior problems, like selling at the bottom during a crash or buying at the top during a euphoric rally. For example, when the index flashes extreme fear after a period of high volatility, it may signal oversold conditions and potential buying opportunities for those willing to practice waiting and act with discipline. Conversely, when the index shows extreme greed during a calm, steadily rising market, it’s often a sign to exercise caution and consider taking profits before the mood shifts.
Smart investors use the fear and greed index as a guide to develop trading strategies that account for both market sentiment and volatility. By combining the index with other tools—such as technical analysis, market momentum volume, and on-chain data—they can make more informed investment decisions and avoid being swept up by the crowd. Practicing patience and waiting for the right moment, rather than reacting impulsively to every swing, is crucial for long term investors looking to navigate the ups and downs of the cryptocurrency market.
The crypto community relies on the fear and greed index to gauge the overall mood, drawing on data from market trends, social media sentiment, Google Trends search volume for crypto related terms, and current volume levels. These factors all contribute to the index’s ability to reflect the prevailing sentiment, whether it’s driven by bad news, surging prices, or shifts in bitcoin dominance.
In summary, market volatility is a key force behind the fear and greed index, shaping the behavior of investors and the overall direction of the crypto market. By understanding how volatility influences market sentiment and using the index alongside other analysis tools, investors can better identify fairly priced opportunities, avoid emotional mistakes, and develop strategies that lead to more consistent profits—even when the market mood is at its most extreme.
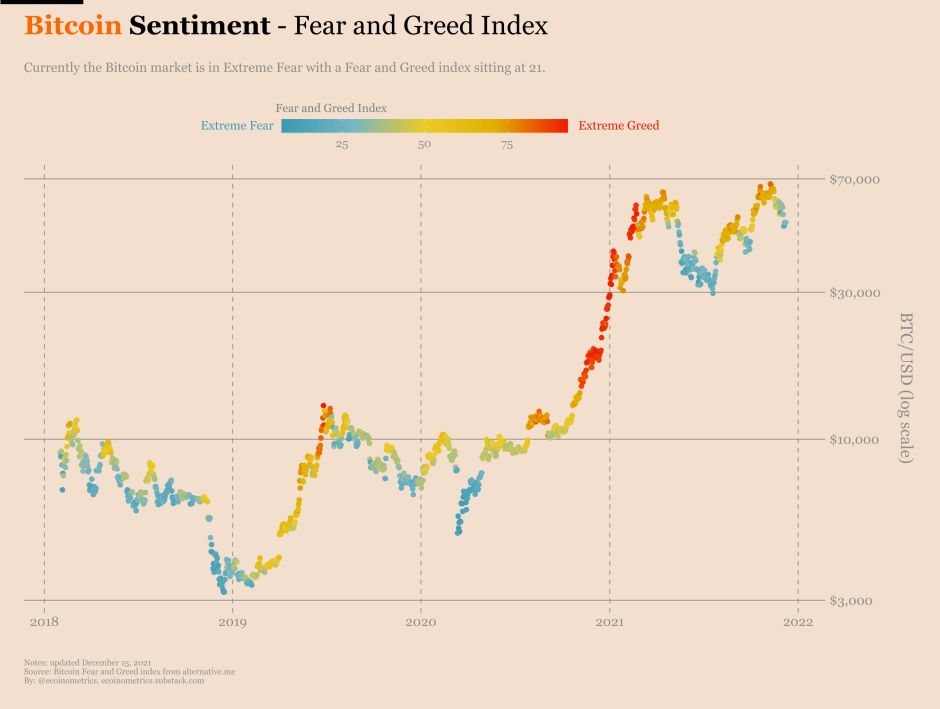
The index has repeatedly flashed extreme fear near major Bitcoin bottoms and high greed before important tops. While past performance never guarantees future results, the pattern has been consistent enough to inform how many traders approach the market.
March 2020: The Covid Crash
Bitcoin dropped below $4,000 on March 13, 2020 as global markets collapsed. The fear and greed index sat around 10, deep in extreme fear territory. Social media overflowed with predictions of further collapse. The ability to buy when everyone else was selling required significant conviction. Those who accumulated during this period saw Bitcoin rally above $60,000 over the following year.
February to November 2021: The Bull Run Peaks
The index pushed above 80 on February 21, 2021 with Bitcoin near $58,000. After a spring correction, greed returned with readings above 80 again in early November 2021. Bitcoin traded near $69,000 at its all time high. Both extreme readings preceded significant drawdowns. The November peak led to a brutal 18 month bear market.
June 2022: The Bear Market Low
On June 19, 2022, Bitcoin traded around $17,500 and the index printed 6, one of its lowest readings ever recorded. Headlines featured exchange collapses, lending platform failures, and widespread capitulation. The conversation in the crypto market turned deeply pessimistic. This extreme fear zone marked the beginning of a prolonged bottoming phase before the next cycle began.
2024 to 2025 Cycle Development
More recent data shows Bitcoin consolidating below key resistance levels with the index oscillating between fear and neutral zones. These readings, like a school teaching lessons, have preceded subsequent legs higher when combined with improving on chain data and macro conditions.
The pattern of extreme fear near cycle lows and extreme greed near cycle highs has repeated across multiple cycles since at least 2018. While not perfect, it offers a perspective that many traders find valuable.
Disciplined buyers tend to move against the crowd by accumulating when the index shows fear and reducing aggressive buying when it shows greed. This contrarian approach requires emotional control that most adults struggle to maintain, but it can be systemized.
A basic framework works like this: begin accumulating slowly when the index falls below 25, provided Bitcoin is holding or reclaiming major support levels like the 200 day moving average. Fear creates discounts, but you still want technical confirmation that the floor is developing.
Consider using a tiered buying plan based on index ranges:
0 to 10: Allocate the largest portion of your buying capital. These readings are rare and have historically marked generational opportunities.
11 to 24: Continue meaningful accumulation. Extreme fear remains, though panic may be easing slightly.
25 to 39: Smaller, regular purchases make sense. Conditions are fairly priced relative to sentiment.
40 to 49: Taper buying activity. Fear is fading and prices typically reflect this.
50 and above: Avoid large new entries. Focus shifts from accumulation to position management.
When the index sits above 75, avoid opening significant new positions. This is often a great time to take partial profits or at least tighten stop losses on existing holdings.
Swing traders can combine index readings with simple chart signals for additional confirmation. A breakout above resistance while the index sits in fear territory, for example, provides both technical and sentiment support for a long position.
Long term investors may prefer intensifying their dollar cost averaging during prolonged fear periods. Several consecutive weeks with the index below 40 have historically offered strong risk adjusted entry points.
Looking at specific past events helps illustrate how these principles could have been applied in real time. These examples serve as educational illustrations rather than guaranteed playbooks.
Scenario 1: March 2020
The index hovered around 10 for several days during the Covid crash. A buyer splitting their allocated capital into three tranches across that week would have averaged into positions between roughly $4,500 and $6,500. Within 12 months, those positions showed returns exceeding 800 percent. The family of those who stayed patient and bought fear experienced life changing gains.
Scenario 2: June 2022
With the index at 6 and Bitcoin under $20,000, panic dominated. Gradual purchases spread across June and July would have resulted in an average entry around $20,000 to $22,000. This proved far superior to waiting for complete macro certainty, which many investors never found until prices had already recovered significantly.
Scenario 3: Early 2023
The index fluctuated between 30 and 40 during a period of recovery. This was not extreme fear, but still represented a room for opportunity. Consistent buying during this milder fear phase also captured meaningful upside as Bitcoin recovered throughout the year.
Position sizing and time horizon remain crucial regardless of index readings. A kid could understand the basic concept: buy when others panic. Executing it requires adult discipline.
The Bitcoin Fear Greed Index should complement rather than replace technical analysis, on chain metrics, and macro context. Treating any single indicator as a complete system leads to inconsistent results.
Pair index signals with simple technical tools to avoid buying into obvious breakdowns. Support and resistance zones, 50 day and 200 day moving averages, RSI, and MACD all help confirm whether the fear is warranted or overdone. An index reading of 15 means little if price is in freefall below all major moving averages.
On chain data adds another layer of confirmation. Watch exchange inflows and outflows, realized price levels, and large holder accumulation patterns. When extreme fear coincides with strong hands buying on chain, the signal carries more weight.
Macro factors including Federal Reserve rate decisions, CPI prints, and dollar index (DXY) movements can keep the index depressed or elevated longer than expected. A plan that ignores these factors may lead to frustration as sentiment persists in one direction for months.
Traders can use sentiment as a filter for strategy selection. Trend following approaches often work better during neutral to greed phases when market momentum supports continuation. Mean reversion strategies tend to outperform during extreme fear spikes when capitulation creates rubber band effects.
Build a simple checklist before executing significant Bitcoin trades:
Index zone: Where does sentiment currently sit?
Price relative to 200 day moving average: Is the trend still intact?
On chain flows: Are strong hands accumulating or distributing?
Macro calendar: Are major economic events approaching?
This framework transforms emotional reactions into a structured decision process.
Acting on sentiment without guardrails can be as dangerous as ignoring sentiment entirely. Risk management remains crucial even when the index screams opportunity.
Cap risk per trade at 1 to 2 percent of total capital even when the index shows extreme fear. If you believe the bottom is in but prices continue falling, you want room to average down rather than facing forced selling at the worst moment.
Place stop losses below clear technical invalidation levels rather than arbitrary percentages. If Bitcoin breaks below a defined support zone, the thesis changes regardless of what the index says. Let price action inform exits.
Use position scaling both in and out. Dividing entries over several days reduces the impact of intraday volatility. Similarly, taking profits in tranches prevents the regret of selling everything just before another leg higher.
Avoid using high leverage when the index sits in extreme greed or extreme fear. Intraday swings become violent during these periods and liquidations are common. Parents warn their kids about playing with fire; traders should treat leverage with similar caution during volatile conditions.
Maintain a cash or stablecoin buffer so you can act when the index enters rare low single digit readings. Having stocks of dry powder ready allows you to leverage opportunities that most investors miss because they are fully allocated.
While the index is popular and widely followed, it has important blind spots. These limitations are crucial considerations for anyone using the Bitcoin Fear Greed Index to inform their investment decisions or conduct market analysis. Treating it as a crystal ball will eventually lead to losses.
The index is mostly reactive, calculated from recent data rather than predictive models. It cannot anticipate sudden regulatory shocks, black swan events, or exchange failures. By the time such events impact the score, prices have already moved.
Extreme fear and extreme greed conditions can persist for weeks or even months. During the 2021 bull run, greed readings stayed elevated for extended periods while prices continued higher. The 2022 bear market saw prolonged fear that trapped impatient contrarians who bought too early and too aggressively.
The index focuses on Bitcoin, which creates blind spots when dominance falls and capital rotates heavily into altcoins. It may not fully capture mania or panic in other parts of the cryptocurrency market.
Social media manipulation presents another challenge. Coordinated narratives, bot activity, and paid promotion can skew sentiment readings. The index may reflect manufactured optimism rather than genuine investor sentiment during certain periods.
Treat the index as one input among many. Backtest any strategy you design around it using past cycles before risking real capital. The greed index explained in isolation tells only part of the story. Always keep these considerations in mind to avoid overreliance on a single metric.
The Bitcoin Fear Greed Index translates crowd emotion into a simple number that tends to reach its lowest levels near market bottoms and its highest levels near speculative peaks. This pattern has repeated across multiple cycles, offering a useful lens through which to view market psychology.
The most favorable long term buying windows have generally appeared when the index sits in deep fear zones, especially below 25. Readings above 75 in extreme greed territory have historically called for caution rather than aggressive accumulation.
Take the time to formalize a simple rules based plan for how you will react to each sentiment band. Write it down before volatility arrives. Knowing your plan in advance prevents impulsive decisions when emotions run high.
Combining the index with sound risk management and complementary tools can transform fear driven chaos into structured opportunity. Every Bitcoin cycle brings panic and euphoria. Those who prepare in advance position themselves to capitalize when others can only watch in fear or chase in greed.