

This is the third of Four training lesson on crypto trading that gives insight about technical analysis of cryptocurrencies.
Rand Training Series March 2020
Candlestick patterns
Candlesticks are one of the major parts of the technical analysis of cryptocurrencies. Candlesticks tool was originated by a Japanese rice trader named Homna back in the 17th century.
A candlestick consists of a vertical line and box. The vertical line is also called the shadow or wick of a candle. The top of the candle represents the highest price of an asset in any given timeframe while the bottom of the candle represents the lowest price of an asset in any selected timeframe. A candle’s wick on top is called top shadow and wick formed at the bottom called lower shadow.
The box which is also called the body of the candle represents the opening and closing price of a candle. If the closing price of a candle is marginally higher than the opening price of a candle then the candle is called bullish while if the closing price of a candle is marginally below the opening price of a candle then the candle is called bearish candle.

Candlestick patterns are very easy to read and trade. Although these patterns can give you good results if used alone, you should use them in conjunction with other technical analysis tools to increase your chances of winning a trade.
Let’s take a look at some of the major candlestick patterns that you can use in your daily trade.
- Marubozu
In Marubozu candlestick patterns opening and closing are equal to the high and low prices, resulting in a candle without any wick/shadow in any direction. If the closing price of a candle is marginally higher than the opening price of the candle and opening price is equal to the highest price and closing price is equal to the lowest price then it is called bullish marubozu described in the picture below as white marubozu. While on the other hand if the closing price of a candle is marginally below the opening price of a candle and higher and lows are equal to the opening and closing prices of the candle then it is called bearish marubozu described in the picture as black marubozu.

- Doji
Doji candlesticks have almost the same opening and closing price with long wicks on both or one side of the body of the candle. Doji candlesticks usually indicate indecision, which can lead to price consolidation or reversal in the price of an asset. There are four kinds of doji candlesticks.
A doji candle with a big shadow below and upper side of the candle is called a long-legged doji as shown in the picture below. Both buyers and sellers are unable to move the market to a particular direction which creates confusion in the trader’s mind. If it is formed after a bullish move in the price it can result in a bearish reversal in the price and if it is formed after a bearish price trend then it might be a signal for a bullish reversal in the price.
Dragonfly doji on the other hand usually represents the bullish reversal in the price. It is formed at the bottom after a bearish trend in the price. Dragonfly doji has long shadow at bottom and small or no shadow at the top with a small body.
Gravestone doji is a signal for a bearish reversal in the price of an asset in a given timeframe. It is usually formed at the top after a bullish trend of an asset. Candle feature a long shadow on the upper side of the candle, small body and small or no shadow at the bottom.

- Spinning tops
Spinning tops candle also shows indecision in the price of an asset at a particular point. This candle has a small body and long wick on both sides of the body. If this candle is formed at the top then it indicates a supply area of an asset and if it is formed at the bottom then it indicates demand area of an asset and can lead to a reversal in the price.

- Hammer and Inverted hammer
Hammer candles indicate the bullish reversal of an asset’s price at the bottom after a downtrend. It indicates that the asset’s price has reached the demand zone and buyers volume is higher than the sellers.
A simple hammer as shown in the picture below is formed with a long shadow below and a small body at top of the candle. There can also be a small shadow on the top of a candle as well. The shadow below the body of the candle should be at least three to four times bigger than the body of the candle.
The inverted hammer is also a bullish reversal candlestick pattern if it is formed at the bottom after a downtrend. It has a small body at the lower bottom of the candle with a big wick on the upper side and small or no wick on the lower side. It tells that buyers tried to push the price up and sellers on the other hand also tried to push the price back lower but could not manage to move it below the opening price of the candle.
- Shooting star candle
Shooting star candlestick pattern is a bearish reversal pattern which is formed after an uptrend move. Shooting star candle has a big shadow on the upper side of the candle and a small or no shadow on the lower side with a small body at the bottom of the candle. It indicates the price has reached a high supply zone where buyers tried to push the price up but sellers took the control and pushed it back down.

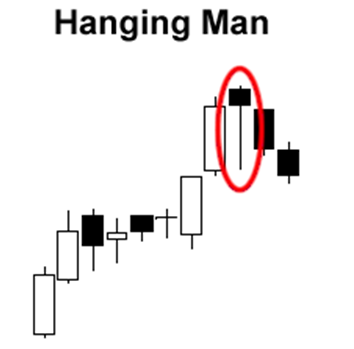
- Hanging man candlestick pattern
Hanging man candlestick pattern is also a bearish reversal pattern which indicates that there is high selling pressure at this spot. Candlestick formation indicates that buyers are trying hard to move the price further up but sellers are gaining control. Hanging man candle as shown in the picture below has a small body at the top of the candle and a big shadow on the lower side of the candle and a small or no shadow on the upper side of the candle.
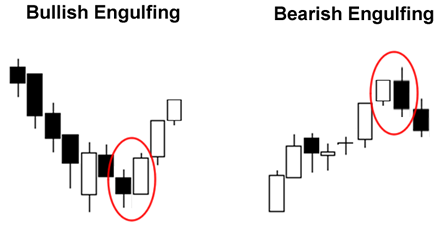
- Engulfing candlesticks
Engulfing candlesticks patterns are price reversal patterns. Bullish engulfing pattern is based on two candlesticks that indicates a bullish reversal in the price. In this pattern, the first candle must be a bearish candle and the second candle should be bullish and engulf the first candle. The second candle should be at least 50% bigger in size than the first bearish candle to consider the pattern strong.
Bearish engulfing pattern is a bearish reversal pattern in the price of an asset after an uptrend. This pattern also consists of two candlesticks where the first candle is a bullish one and the second candle is bearish and more than 50% bigger than the size of the first bullish candle. The bigger the second candle, the stronger the signal.
- Tweezer bottoms and tops
Tweezer candlestick patterns are also two candlestick price reversal patterns. Tweezer bottoms candlestick pattern appears after a downtrend in the price. The first candle should be bearish with a long shadow on the lower side of the candle and the second candle should be bullish with the same size, lows and body.
Tweezer tops candlestick pattern is also a two candlestick pattern which indicates the bearish reversal of an asset. It appears after an uptrend move in the price of any asset. The first candle should be bullish with a long wick on the upper side of the candle while the second candle should be a bearish candle with the same size, highs and body to qualify for a tweezer tops candlestick pattern.

- Evening stars candlestick pattern
Evening star candlestick pattern is a bearish price reversal pattern which is formed after an uptrend move. The pattern consists of three candles where the 1st candle is a bullish candle and the second candle is a small body candle which indicates indecision in the price of an asset. The third candle confirms the reversal with a bearish candle which should be at least half of the size of the first candle.

- Morning stars candlestick pattern
Morning star candlestick pattern is a bullish reversal pattern which indicates that the price has reached a demand zone and bulls are looking to take control. This candlestick pattern is also based on three candlesticks where the first candle is usually a big bearish candle and the second candle is a small body candle with wicks on both sides. While the third candle should be bullish and at least half of the size of the first bearish candle to confirm the pattern.

That is what we have got for today. Hope you have liked it. Please don’t forget to give your feedback.
Follow us on Twitter to see every article on this topic.